| 1.
|
Connect
the datalogger interface to a PC with the software installed.
|
| 2.
|
Connect
the photogate to the appropriate channel of the interface.
|
| 3. |
Screw
the aluminum rod into the hole at the end of the desk.
|
| |
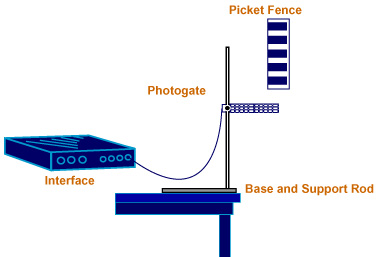
- Figure 1-
|
| 4. |
Clamp the
photogate to the aluminum rod, as shown in Figure 1, approximately
60cm from the surface of the table.
The photogate that will be used in this experiment consists of
an infrared light-emitting diode and a photodetector mounted on
a bracket as shown in the photograph to the right. The voltage
across the photodetector depends on the intensity of the light
incident upon it.
By monitoring the photodetector voltage, the interface can sense
whether the light path from the LED to the detector is blocked
or not. The datalogger software can record the times at which
the detector becomes blocked and unblocked.
|
| 5. |
Place a box with shredded paper directly under the photogate to
absorb the impact of the picket fence when it lands.
|
| 6. |
Start the software to collect data.
|
| 7. |
Hold
the picket fence so it is vertical with the bottom edge of the first
stripe approximately 5cm above the photogate and drop the picket
fence through the photgate.
|
| 8. |
After
the picket fence drops, stop the collection of data. |