Distance
and Time
Experiment
Profile
1. Objective
To investigate the relationships between position, velocity, and acceleration
against time.
2. Theory
When describing the motion of an object, knowing
where it is relative to a reference point, how fast and in what
direction it is moving, and how it is accelerating (changing its
rate of motion) is essential. As the object moves, the change in
its position is measured many times each second. The change in position
from moment to moment is expressed as velocity (metres per second).
The change in velocity from moment to moment is expressed as an
acceleration (metres per second). The position of an
object at a particular time can be plotted on a graph.
3. Equipment List
|
|
Datalogger
interface |
|
|
Base and
support rod |
|
|
Motion
sensor |
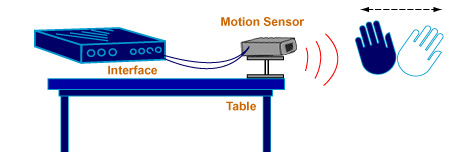
Procedure
For this activity, your hand will be the object in motion. The
motion sensor will measure your hand position as you move in a straight
line at different speeds. We will use the datalogger software to
plot the motion on a graph of position and time.
Computer Set-up
| 1.
|
Connect
the datalogger interface to the computer. |
| 2.
|
Connect
the motion sensor to the interface. |
| 3. |
Open
the datalogger software to create a new data file for this activity. |
| 4. |
Record
the data of time (sec), position (m), velocity (v) and acceleration
(a).
|
| 5. |
Prepare
to plot graphs of position versus time, velocity versus time and acceleration
versus time. |
Experience Set-up
Set-up the motion sensor as shown in the following
graph. Make sure you can move at least 2 metres away from the motion
sensor. Position the computer monitor so that you can
see it while you move away from the motion sensor.
Data Recording
Place your hand in front of the motion sensor.
Use the datalogger software to start recording data.
Watch the plot of your hand's motion on the graph and try to move
so that the graph display is a straight line with different angles.
Data Table